Inactivation
A channel is closed by two mechanisms. The S4 helices of the activation gate can be pulled back toward the inner-membrane surface
by increasing the negativity at that surface; this type of closure is called deactivation. The channel can also be closed
by the inactivation gate moving to obstruct the pore; this type of closure is called inactivation and it usually occurs
first and deactivation occurs while the channel is still inactivated.
Sodium Channels
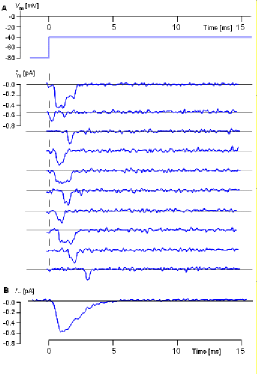
 The illustration to the left (From Hille, 1992, as provided by J. B. Patlak; see also Patlak and Ortiz, 1986.) shows actual recordings taken
from single sodium channels. The inward sodium current ... rather than outward as it was for the potassium current ... is shown as
a downward deflection.
Another obvious difference between these recordings, compared to those from the potassium channel described in the previous section, is that the
sodium channel opens only once.
Each recording was performed at the same voltage. The protocol at the top indicates an initial inner-membrane charge of -80mV was 'stepped'
to -40mV and held there for 15 milliseconds.
The individual recordings show that the channel opened only once, did not always open immediately and did not stay open for the same length
of time. An average of many such recordings is shown below the individual examples and indicates how the current would appear
if a population of sodium channels was subjected to the same protocol.
This current would reach a maximum quickly before gradually decaying within 5 milliseconds.
The decay of the current can not be due to closure of activation gates (deactivation) because that requires that the negativity of
the inner-membrane surface be increase rather than maintained at -40mV.
Therefore, the current decay must be due to inactivation gates obstructing pore openings. This 'decay' of the current
occurs because individual channels remain open for slightly different lengths of time before their pores becomes obstructed.
Removal of Inactivation
 A sodium channel inactivates quickly and is refractory ...cannot be stimulated to reopen ... until its inactivation gate has moved
away from the pore opening. The next protocol is designed to determine how long it takes for all the
sodium channels in a population to recover from inactivation at -70mV.
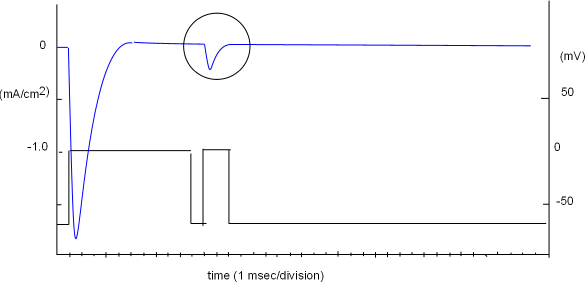
The protocol is shown in the lower part of the graph to the right and the right vertical axis (millivolts, mV) is part of it. The vertical
axis to the left (mA/cm2) goes with the current curve (blue) indicating the amount of current per square centimeter of
membrane surface; the 'patch' covered by the pipette tip contains a population of sodium channels.
The protocol consists of two voltage steps; the first is a 'conditioning' or 'prepulse' step while the second is a 'test' step.
Initially the voltage was set to -70mV and the current
curve verified that there was no current ... activation gates were closed. The conditioning step reduced the negativity to zero millivolts ...
sufficient to provide a large open probability ... and an inward (-) current of ~1.7mA/cm2 was produced. This current decayed
within a few milliseconds even though the voltage was maintained for 10msec. The shape of the current curve is as predicted from the
previously described average of individual channel currents.
 The negativity at the inner-membrane surface was briefly (1 msec) increased back to the original -70mV level in order to close
all activation gates. When the second (test) step decreased
the negativity back to zero mV a small current was produced, as shown within the circle, indicating that at least some of the channels
within the population had recovered from inactivation at this point in time.
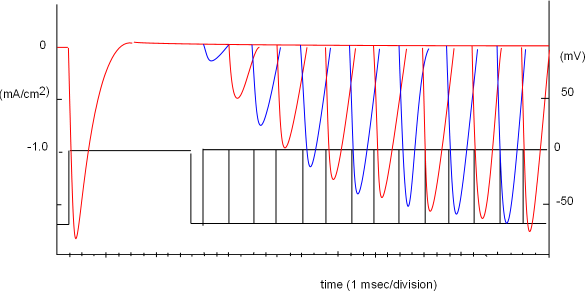
This protocol was repeated thirteen more times but the 'wait time' between the two steps was incrementally increased by 2 milliseconds.
Each time, the test current increased until, at the thirteenth test, enough time had passed so that all inactivation gates had moved out
of the pores.
All these test curves have been superimposed to produce the graph at the left; different colors make it
easier to differentiate one curve from the next. Note the combined protocols shown in the bottom portion of this graph.
The thirteenth test step shows it required 37 msec, after the start of the conditioning step, for all channels to recover from inactivation.
Updated: 04/26/2015
Continue to Currents & Gradients
Return to previous tutorial ... Activation
Return to home page
 The illustration to the left (From Hille, 1992, as provided by J. B. Patlak; see also Patlak and Ortiz, 1986.) shows actual recordings taken
from single sodium channels. The inward sodium current ... rather than outward as it was for the potassium current ... is shown as
a downward deflection.
Another obvious difference between these recordings, compared to those from the potassium channel described in the previous section, is that the
sodium channel opens only once.
 A sodium channel inactivates quickly and is refractory ...cannot be stimulated to reopen ... until its inactivation gate has moved
away from the pore opening. The next protocol is designed to determine how long it takes for all the
sodium channels in a population to recover from inactivation at -70mV.
 The negativity at the inner-membrane surface was briefly (1 msec) increased back to the original -70mV level in order to close
all activation gates. When the second (test) step decreased
the negativity back to zero mV a small current was produced, as shown within the circle, indicating that at least some of the channels
within the population had recovered from inactivation at this point in time.
This protocol was repeated thirteen more times but the 'wait time' between the two steps was incrementally increased by 2 milliseconds.
Each time, the test current increased until, at the thirteenth test, enough time had passed so that all inactivation gates had moved out
of the pores.