Activation
Whether an activation gate is open or closed depends on which surface of the membrane is the more negative of the two and whether or not the
negativity is sufficient to attract, and hold, the positively
charged S4 helices of the activation gate. As that surface becomes relatively less negative, its hold on these helices weakens and they tend to migrate toward the opposite
surface. There is evidence that the four individual S4 helices move back and forth independently of one another; all four must simultaneously
be at the outer surface for the pore to be open and allow ions to diffuse through it.
Patch-Clamp Experiments
To study channels, a small section of cell membrane ... with only a single channel in it ... needs to be isolated. To accomplish this,
the tip of an ultra narrow pipette is held, by suction, over a single channel on the surface (patch) of a cell membrane. Electronic
equipment is designed that can control the charge at the inner and outer membrane surfaces. When the negativity at
the inner-membrane surface is held (clamped) to a specific value allowing activation gates to open, the flow of ions through these
channels can be measured.
The following experiments indicate the charge that is 'clamped' at the inner-membrane surface; it is recorded in millivolts (mV).
A large negative value indicates the inner surface is very negative relative to the outer surface. The value at the inner surface can be
positive indicating that the outer surface is the more negative of the two. The recordings are very fast (milliseconds) and show
when, and for how long, a channels is open and allowing ions to flow through its pore.
Opening is Random
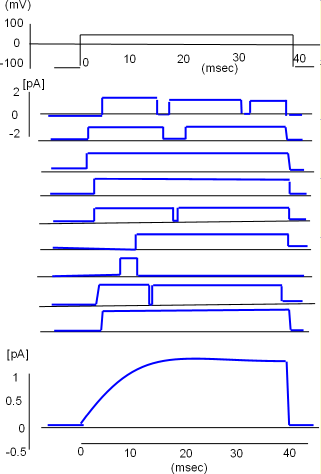
 The top illustration to the right depicts the procedure (protocol) that was followed to obtain nine recordings from a single potassium
channel. Initially, the charge at the
inner-membrane surface was set at -100 mV which was sufficiently negative to hold the S4 helices down thus closing the channel.
Then the negativity was greatly decreased to +50 mV, sufficient to pull all S4 helices toward the outer surface, and held there for 40 milliseconds before
being returned to -100mV.
Just to the left of the first recording is a small scale that goes from +2 to -2 picoamps (measure of the
amount of current). The recording pen moved up when the channel was open and returned to baseline when the channel was closed.
A close inspection of each channel shows it did not respond the same way each time it was subjected to the protocol.
The channel did not always open immediately nor did it open the same number of times or stay open the same length of time.
The openings were random.
Although the channel did not always behave the same way each time, the average of its individual recordings
gives a good indication of how the current would appear if multiple channels respond simultaneously. This is illustrated
by the graph below the individual recordings. Notice the current increases gradually before stabilizing. The slow beginning
is a result of not all channels initially opening at the same time. Also note that the current continues to flow as long
as the inner-membrane charge is held at +50mV but abruptly stops as the S4 helices are pulled toward the inner surface
when the charge is returned to -100mV.
Voltage Dependence
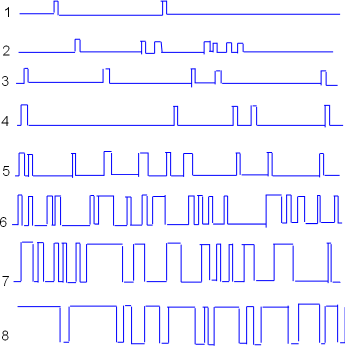
 Similar patch-clamp experiments can be performed to determine the effect of clamping to different inner-membrane
voltages. Samples of such recordings are shown to the left. The voltage settings were gradually made less negative
going from recording #1 through recording #8.
 Patch-clamp experiments like these provide information about the probability of channels being open (Po)
when the inner-membrane surface is at various levels of negativity.
It appears that the channel was
open approximately 50% of the time in recording #6 and perhaps 90% of the time in tracing #8. To generalize, there is a low probability
of the channel being open (Po) when the inner-membrane charge is more negative and the open probability
increases as that charge becomes less negative.
The graph to the right plots open probability (0 to 1 with 1 being
100% probability of being open) against the negativity at the inner-membrane surface (millivolts,mV). This graph shows that the
channel in question shows the first sign of a opening at ~-60 (first dotted line) and the channel reaches its maximum open probability at
~-10 (second dotted line).
Updated: 04/29/2015
Continue to Inactivation
Return to previous tutorial ... Channel Structure
Return to home page
 The top illustration to the right depicts the procedure (protocol) that was followed to obtain nine recordings from a single potassium
channel. Initially, the charge at the
inner-membrane surface was set at -100 mV which was sufficiently negative to hold the S4 helices down thus closing the channel.
Then the negativity was greatly decreased to +50 mV, sufficient to pull all S4 helices toward the outer surface, and held there for 40 milliseconds before
being returned to -100mV.
 Similar patch-clamp experiments can be performed to determine the effect of clamping to different inner-membrane
voltages. Samples of such recordings are shown to the left. The voltage settings were gradually made less negative
going from recording #1 through recording #8.
  Patch-clamp experiments like these provide information about the probability of channels being open (Po)
when the inner-membrane surface is at various levels of negativity.
It appears that the channel was
open approximately 50% of the time in recording #6 and perhaps 90% of the time in tracing #8. To generalize, there is a low probability
of the channel being open (Po) when the inner-membrane charge is more negative and the open probability
increases as that charge becomes less negative.