 Both the threshold of activation and the equilibrium potential for a given type of channel can be determined in
the following manner.
Both the threshold of activation and the equilibrium potential for a given type of channel can be determined in
the following manner.The previous 'Activation' section described how the voltage-sensing S4 helices of voltage-gated channels move in response to electrical charges at the membrane surfaces. These helices are positively charged and their movement is affected by the charge difference across the membrane, i.e., the membrane potential. In most cases, when they are toward the inner surface, the channel is closed; when they are toward the outer surface the channel is open. But what are the membrane potential values that result in sufficient movement of these helices so that a current will occur?
The resting membrane potential of cardiac muscles (-90mV) keeps the S4 helices of all voltage-gated channels attracted to the inner surface so that none of these channels open. However, as this value become less negative, this attraction will weaken and the S4 helices will begin shifting to open the channels. When open, sodium ions will influx 'down their concentration gradient' into the cell. The voltage at which enough channels open to cause at least a small current is often called the threshold of activation. As long as channels are open a current will flow until an equilibrium potential is reached where the outward and inward driving forces counterbalance each other.
 Both the threshold of activation and the equilibrium potential for a given type of channel can be determined in
the following manner.
The current/time graph and protocol to the left show a series of sodium currents that occurred at several different membrane potentials. The protocol shows a 'holding' (initial) potential of -100mV that is 'stepped' and clamped to more a series of more negative potentials for a few milliseconds.
The graph indicates that no current occurred when the membrane potential was held at -100mV but when the potential was stepped to -60mV (red line) a small inward current occurred (red curve). The second test stepped the potential from -100mV to -40mV (blue line); the current produced (blue) was greater than before. The current was increased yet again when the step goes went to -20mV (orange line).
However, with further depolarizations, the current progressively becomes smaller (fuschia and green curves). At the 60mV potential there was no current at all ... straight black line on graph. And, when the potential was stepped a more positive potential (light blue line and curve), an outward, rather than an inward, current was generated. (Recall that, in current/time curves, downward deflections represent inward currents and upward deflections represent outward currents.)
The lack of current at 60mV indicates that this value was the equilibrium potential for sodium ions at the internal and external concentrations used in this experiment. The fact that the direction of current reversed at membrane potentials positive to the equilibrium potential indicates that the electrical driving force now exceeds that of the concentration gradient. For this reason, an ion's equilibrium potential is often referred to as its reversal potential.
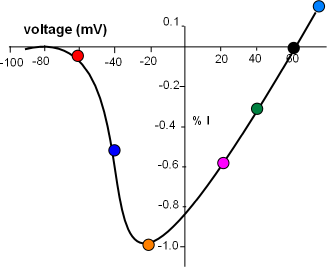
 The current/voltage graph of the peak current for the above series of curves is shown to the left.
Voltage (mV) is on the horizontal axis
running from -100 to just greater than 60mV. Current (I) is on the centrally located vertical axis; positive values indicate an outward
current while negative values indicate an inward current.
The greatest peak current is set to be equivalent to -1.0 (orange circle) with the others plotted relative to this.
Each colored circle was plotted using the data from the above series of graphs.
There is no current at the 60mV equilibrium potential where the curve crosses the horizontal axis and, more positive to that value, the current reverses direction. At the other end of the graph the lack of current at values more negative than -70mV indicates that no sodium channels are open. A small current (red circle) reflects the low open probability at this 'activation threshold'. The current doubles at -40mV quickly reaching a maximum at -20mV. This rapid increase is due to the increasing open probability of the channels as the decreasing negativity at the inner-membrane surface weakens its 'hold' on the S4 helices of the activation gates.
With the channels now fully opened the effect of the continuing influx of positive charge can be seen. As positive sodium ions continue to accumulate at the inner-membrane surface their repulsion of the additional influx of sodium ions increases thus slowing down this current even further. By 40mV the current has decreased to 30% of maximum and completely stops at the equilibrium potential. At this potential the inward (concentration) driving force is equal to the outward (electrical) driving force.
Updated: 5/2/2015
Continue to Action Potentials
Return to previous tutorial ... Potentials
Return to home page