Action Potentials
An action potential occurs when the membrane potential of a cell depolarizes then repolarizes. This is set in motion by
a stimulus, either internal or external to the cell, causing various ion channels to open and close allowing ions to briefly
enter and exit the cell. The first phase of the action potential (depolarization) is when positive ions influx more
rapidly than they eflux; the second phase (repolarization) is when positive ions efflux more rapidly.
Influxing & Effluxing Currents
Resting potentials are negative, as described in a previous section on Potentials,
and something must 'stimulate' the cell membrane to stop 'resting' and exhibit an 'action potential'. Whatever the
actual 'stimulus', the membrane must depolarize sufficiently to reach the activation threshold of a population channels that permits
positive ions to enter the cell. The initially small open probability of these channels will increase due to the depolarizing
effect that influxing positive ions have on the membrane potential. As the membrane potential continues to depolarize, the activation thresholds
of other populations of channels will be reached and the motion of those ions will exert their effects on the membrane potential.
Simultaneous Currents
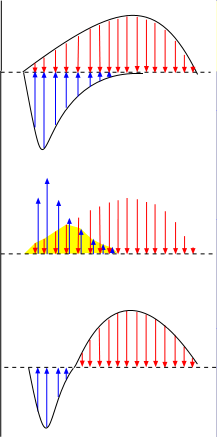
 The top graph to the right shows two curves; the one below the line is an influxing current and the one above the
line is an effluxing current. The arrows within the curves are vector arrows that indicate the strength and direction
of the currents over time.
The overall current that results from both these currents occurring simultaneously can be determined as shown in the
middle illustration.
- The blue current arrows are moved up beside the red arrows .
- The sections where the paired red and blue arrows cancel each other are eliminated (yellow background).
- The remaining blue arrows are returned to their original position below the baseline.
- The remaining red arrows are brought down to touch the baseline.
The third illustration shows the combined currents. As shown in the top illustration, there is an influxing current (blue)
during the first half of the time period while an effluxing current (red) continues the entire time. The combined currents
give an initial short-lived bell-shaped influxing current followed by a bell-shaped effluxing current that lasts twice as long.
Currents & Membrane Potentials
 The previous graphs show a vector representation of current as a function of time. But
action potential graphs show the membrane potential as a function of time. This would require converting the currents from the
last graph in the above series to membrane potentials.
We can approximate this by using the vector arrows from the last graph given the following facts:
- The downward-pointing blue arrows represent the influx of positive charges that would cause depolarization.
- The upward-pointing red arrows represent the efflux of positive charges that would cause repolarization.
- The length of each arrow represents a relative amount of current so that a 10mm line would represent twice as much
current as a 5mm line.
- Currents are additive; the amount of positive charge moved across the membrane is added to that which has already accumulated.
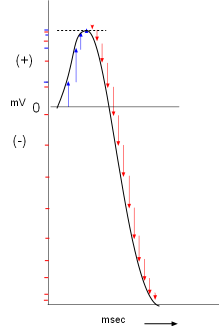
As shown to the right, a membrane potential scale (millivolts, mV) is drawn on the Y-axis with time (milliseconds, msec)
on the X-axis. A horizontal line is drawn at 0mV that will be used as an arbitrary starting point. The first arrow from
the final graph is positioned close to the beginning of this line. It indicates a small inward positive current that would slightly increase
the membrane potential (small blue mark on the Y-axis opposite the arrowhead) from it's starting value of 0mV.
The next arrow is added a short distance to the
right of the first (a millisecond has passed) so that it starts where the previous arrow left off (the charges accumulate).
The membrane potential is more positive as shown by the corresponding blue mark on the Y-axis. The remaining two blue arrows are
added in like manner but these small currents did not increase the membrane potential too much.
The repolarizing (red) arrows are added after the blue arrows following the same procedure. Notice the red marks on the Y-axis
that correspond to each arrow. During this repolarizing current the membrane potential fell rather sharply into the
negative range. The line connecting the arrowheads resembles an action potential graph.
Action Potentials
 This is a graph showing the basic shape of a neuron action potential. Notice the initial horizontal (resting) membrane potential
followed by a depolarizing then a repolarizing section. The repolarization goes below the level of the initial resting potential
before slowly returning to that level.
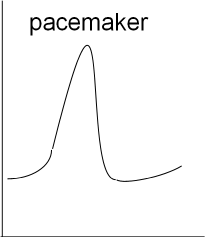
 Next is a graph showing the basic shape of a cardiac pacemaker action potential. The depolarization and repolarization is similar to
that of the neuron but there is no resting potential (flat, horizontal line). Instead, immediately following repolarization the
membrane potential begins a slow depolarization that will initiate another rapid depolarization.
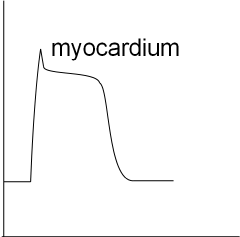
 The last graph shows the basic shape of a myocardial action potential. There is a resting potential and a rapid depolarization that
is followed by a brief repolarization that levels out to a plateau. During the plateau influxing and effluxing currents are equal.
This is followed by repolarization back to the resting potential.
Other tutorials in this website describe, in detail, the ionic events that take place during a cardiac pacemaker action potential
and, in the near future, a myocardial action potential.
Updated: 5/4/2015
Return to previous tutorial ... Potentials
Return to home page
 The previous graphs show a vector representation of current as a function of time. But
action potential graphs show the membrane potential as a function of time. This would require converting the currents from the
last graph in the above series to membrane potentials.
 The top graph to the right shows two curves; the one below the line is an influxing current and the one above the
line is an effluxing current. The arrows within the curves are vector arrows that indicate the strength and direction
of the currents over time.
 This is a graph showing the basic shape of a neuron action potential. Notice the initial horizontal (resting) membrane potential
followed by a depolarizing then a repolarizing section. The repolarization goes below the level of the initial resting potential
before slowly returning to that level.
 Next is a graph showing the basic shape of a cardiac pacemaker action potential. The depolarization and repolarization is similar to
that of the neuron but there is no resting potential (flat, horizontal line). Instead, immediately following repolarization the
membrane potential begins a slow depolarization that will initiate another rapid depolarization.
 The last graph shows the basic shape of a myocardial action potential. There is a resting potential and a rapid depolarization that
is followed by a brief repolarization that levels out to a plateau. During the plateau influxing and effluxing currents are equal.
This is followed by repolarization back to the resting potential.